Contact
Dashboards and Reports

Dashboards and Reports

Create dashboards and reports for every level, business unit, or region. Our powerful, no-code report wizard creates data tables, charts, and graphs using any data available in Wintouch.

Dashboards for Every Level, Business Unit, & Region

  • Executive

    Executive Dashboards can display data from all levels, business units (sales, marketing, support), and regions.
    Executive Dashboard
  • Marketing

    Keep track of your most valuable lead sources, campaigns, regions, and more.
    Marketing Dashboard

Drag & Drop Dashboard Designer

An intuitive drag and drop dashboard designer gives you control to add, change, or move components on various dashboards.

Mobile Dashboards

Customize dashboards for both phone and tablet for all levels, business units, or regions.

No-Code Report Wizard

Our easy-to-use report wizard creates data grids, aggregation boxes, and charts which can be added to dashboards, Account/Profile summary screens, or to the main toolbar.

Use All Data

Use any data stored in Wintouch for reports.

Chart Types

Data Grid (exportable to .xls)
Aggregation Box
Tiered Grid
Bar
Column
Line
Area
Pie
Map Region
Map Marker

Advanced Conditions

Multiple and/or Conditions Compare Fields
Advanced Time Parameters

Sorting & Filtering

Pre-define sorting for charts.
Live sorting and filtering for data grids.

Toolbar Shortcuts

Add shortcuts to the main toolbar for essential reports.

Dynamic Conditions

Avoid redundant reports by dynamically identifying the current user, date, Account, or Profile to narrow the results automatically.

Advanced Reporting Services

We offer advanced reporting services for situations that require complex queries and multi-layer drill-through reports.

Dashboards

Optimize your marketing investments by leveraging the power of your CRM data. Measure the success of your campaigns with lead generation statistics available to your marketing team in their Wintouch dashboard and custom reports. Examine trends in the data, decrease the amount of guesswork, and find the marketing strategies that are most effective. Furthermore, you can measure the conversion rate of those leads and calculate the returns on your marketing investments.
Learn More

Macro & Detail Views

Our dashboards show relevant information from all your enterprise systems, summarized in charts, tables, and text boxes, helping users identify and complete their most important tasks. They can be tailored towards various departments like sales and customer service, or for different levels like executive, management, reps, etc.
Learn More

Custom Reporting

With Datasheets, your staff can define and generate custom reports on the fly based on any data in your system that they have access to. Datasheets can be defined with multiple and/or conditions to help you find exactly what you are looking for. They can also be saved, shared, and exported to Excel.
Learn More

Team-Specific Dashboards

Your business teams function differently from one another, care about different metrics, and use different custom modules. We believe that when dashboards provide useful information, they can help increase the efficiency and effectiveness of each staff member.
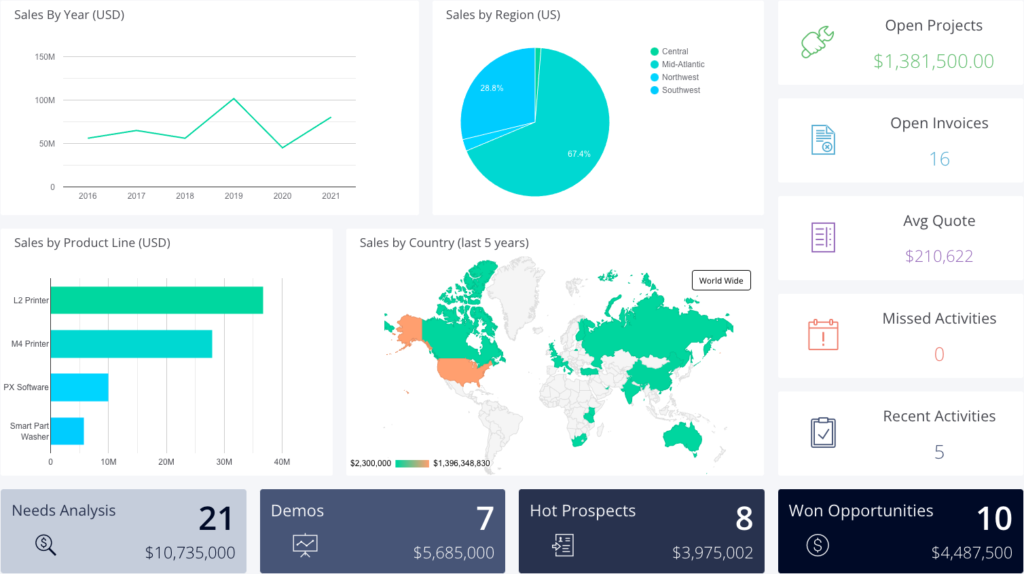
Sales

To close more deals, your sales team needs information. A well organized sales dashboard helps your reps understand the bottlenecks in your pipeline, identify and prioritize promising leads, and measure their performance.
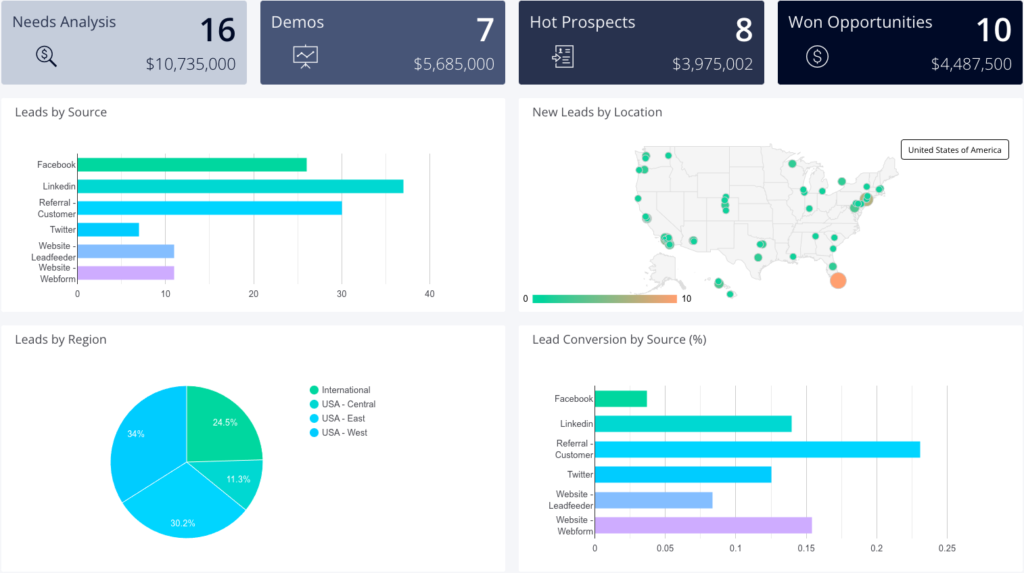
Marketing

Your marketing team is focused on generating interest and ultimately leads. Analyzing statistics on recent leads and weighing those against different types and intervals of marketing campaigns can help you achiever higher returns on your advertising investments.

Customer Service

Every business benefits from a top-notch service team that excels in efficiency and follow-through. A well constructed dashboard gives you a bird’s eye view of what inquiries are pending, and what each of your service reps have on their plate. You can then distribute the workload and make adjustments to keep things running smoothly.

Your reps will see their inquiries, overdue activities, priority inquiries, and their completed activities which can be used by them to measure their own performance. In conjunction with our other features like task automations, workflows, reminders, and email/calendar integration, your service team will be equipped with a range of tools that assists with monotonous tasks and helps to eliminate human error.

Drill-through Dashboards

The structure of our dashboards help organize the vast amount of data available within Wintouch. Charts, graphs, and tables based on your important metrics, along with the ability to take a closer look at the data behind them helps you identify the areas of your business that are doing well and discover areas that can use improvement.

30/90/180/365 Day & Prior Years' Performance

Measure your performance with these standard reports. Drill trough to see how product categories, individual products, or sales reps are doing over these time periods.

Sales by Region, Product Category, Sales Team, etc.

If you have data on it, it can be queried and displayed in the dashboard. Anything that will help give you a better insight into the performance of your organization or business can be placed in the dashboard.

Service Inquiries/Incidents by Type, Priority, Product

Organizing your service inquiries and seeing statistics based on your classifications can help you identify a variety of patterns. When your data is displayed well, you are more likely to quickly identify issues like a sudden spike of inquiries for a specific product. Drilling into details to find the root cause takes only a few clicks and gets you back on track faster.

Custom Reporting with Datasheets

Datasheets are custom reports that can be generated and defined by any of your staff that is given access to them. They can be used to quickly find a specific piece of data, or as a more permanent report.

Speed and Simplicity

Generating a Datasheet is as simple as selecting the data you are looking for and defining conditions to narrow the dataset. The output is a table that will be updated each time the Datasheet is run.

Sort & Filter

Datasheets can be sorted and filtered by clicking on the column headings and selecting options from the dropdown menu.

Save, Share, & Export

For reports that will be used repeatedly, Datasheets can be saved and shared with any relevant team members. Once a Datasheet is run, it can be exported to an .xls spreadsheet via a button in the toolbar.

Interested in learning more?

We'd love to give you a tour!

Schedule a demo

Copyright © 1991-2021 Touchtone Corporation

homemagic-wanddatabaseenvelopephone-handsetmap-markerpie-chartmenuchevron-downcross-circlefunnelsort-amount-asc linkedin facebook pinterest youtube rss twitter instagram facebook-blank rss-blank linkedin-blank pinterest youtube twitter instagram